Newsletter
Suscríbete a nuestro Newsletter y entérate de las últimas novedades.
https://centrocompetencia.com/wp-content/themes/Ceco
volver
La definición del mercado relevante busca identificar a todas las empresas que se ejercen presión competitiva mutuamente, por ejemplo, que limitan la capacidad de subir los precios o bajar la calidad o la innovación. En palabras simples, la definición del mercado relevante trata de separar los productos y servicios que compiten entre sí, de aquellos que no.
Existen dos dimensiones en la definición del mercado relevante. La primera considera qué productos compiten (mercado relevante del producto) y la segunda, dónde compiten estos productos (mercado relevante geográfico).
A la hora de delimitar un mercado, en ocasiones será necesario probar estos límites utilizando modelos establecidos y herramientas económicas aceptadas. Estos métodos buscan verificar si un mercado teórico existe en la realidad y garantizan que las definiciones de mercado no sean demasiado estrechas o amplias, distorsionando la posterior evaluación de concentración, poder de mercado y efectos anticompetitivos.
La definición del mercado relevante es una de las herramientas primordiales de la política y el derecho de competencia, presente en la mayoría de sus áreas, desde fusiones o concentraciones, pasando por abusos de posición dominante, hasta acuerdos verticales u horizontales (OECD, 2012). Tradicionalmente, la determinación del mercado relevante es el primer paso para evaluar el poder de mercado de un agente económico y con ello, si una conducta u operación particular puede producir efectos anticompetitivos.
Un principio rector aceptado para definir el mercado relevante del producto fue aportado por Bishop y Darcey (1995) y sostiene que un mercado relevante es aquel que vale la pena monopolizar, puesto que incluye todos los productos sustitutos y, por lo tanto, el control de ese mercado permitiría aumentar de forma rentable los precios de los productos hasta el nivel de monopolio.
La medida en que las empresas pueden aumentar sus precios por encima de los niveles normales de competencia depende de la posibilidad y disposición de que los consumidores compren otros productos (sustitución de la demanda) y de la capacidad y disposición de otras empresas para suministrar esos productos (sustitución de la oferta). Cuanto menor sea el número de productos sustitutos y/o más difícil sea para otras empresas empezar a suministrar esos productos, menos elástica será la curva de demanda y, por lo tanto, más probable será encontrar precios más altos.
A partir de esta noción, el mercado relevante del producto se determina principalmente considerando dos criterios: sustitución de la demanda y sustitución de la oferta.
En general, existe consenso en que el foco del análisis debe estar prioritariamente en la sustitución de la demanda. Tal como afirman las agencias estadounidenses -la Federal Trade Comission (FTC) y el Departamento de Justicia (DoJ)- en sus «Horizontal Merger Guidelines” de 2010:
“La definición del mercado se centra únicamente en los factores de sustitución de la demanda, es decir, en la capacidad y la disposición de sustituir un producto por otro en respuesta a un aumento de precio o a un cambio correspondiente no relacionado con el precio, como una reducción de la calidad del producto o del servicio”.
Esto enfoque es respaldado por expertos que argumentan que puede ser confuso y complejo tomar en cuenta ambas fuerzas económicas -la sustitución de la demanda y de la oferta- en una misma etapa de análisis (Baker, 2007).
Al examinar las potenciales respuestas de los consumidores, lo importante es la respuesta del consumidor marginal, no la del consumidor medio. Por lo tanto, se considera que un número pequeño pero significativo de consumidores que se cambia a otro producto, ante un aumento en el precio, es indicio de que ambos bienes forman parte del mismo mercado relevante.
Para determinar el alcance y nivel de la sustitución por parte de la demanda que implicaría que la monopolización no fuese conveniente, es necesario evaluar la elasticidad del precio de la demanda.
El test del monopolista hipotético -presentado por primera vez en las pautas sobre fusiones de Estados Unidos de 1982- se ha utilizado desde entonces, no exento de modificaciones, para evaluar las fuerzas de sustitución de la demanda.
Para definir el mercado relevante de productos, es necesario identificar a aquellos sustitutos cercanos. Pero, ¿qué se debe considerar como un sustituto cercano?
La forma más habitual de identificar el mercado relevante de un producto es a través del SSNIP test, de sus siglas en inglés «Small but Significant Non-Transitory Increase in Price». Este test econométrico también es conocido como el “Test del Monopolista Hipotético”.
En palabras simples, se comienza con un grupo de productos que podrían componer el mercado relevante y se crea un escenario hipotético en el cual una única empresa controla la totalidad de estos productos. A continuación, se simula el efecto de un pequeño pero significativo aumento permanente del precio (del orden de un 5% o 10%). Si los consumidores reaccionan a esta hipotética subida de precios comprando otros productos, entonces esos productos se deben incluir en el mercado de referencia y se repite la prueba, hasta que no exista sustitución significativa.
Lo que se intenta calcular es la elasticidad de la demanda residual de la empresa. Es decir, cómo afecta el cambio en el precio del producto de la empresa a la demanda de dicho producto. Existen muchas variaciones de esta prueba en función de la naturaleza del mercado estudiado, y existen dificultades prácticas a la hora de su implementación. Baker (2007) discute en mayor profundidad estos desafíos.
Para llevar a cabo la prueba del monopolista hipotético en la práctica, es necesario estimar la elasticidad de la demanda y compararla con la elasticidad crítica. La pregunta crucial que este ejercicio persigue responder es: ¿cuál es la magnitud de la sustitución de la demanda máxima para que sea rentable un alza del precio?
En el caso de un SSNIP, un monopolista hipotético enfrenta una disyuntiva (o trade-off) cuando aumenta el precio de los productos. Por un lado, sus ganancias aumentan gracias al aumento del margen precio-costo de las unidades que continúa vendiendo después del alza (efecto inframarginal). Sin embargo, el alza del precio también tiene un efecto negativo en las ganancias, ya que algunos consumidores dejan de comprar o sustituyen los productos (efecto marginal). A mayor elasticidad de la demanda, mayor es el efecto marginal negativo sobre los beneficios. La suma de estos efectos opuestos sobre las ganancias determina si el aumento del precio es rentable o no.
Se ha propuesto una metodología cuantitativa que intenta comparar estos efectos para poder definir el mercado relevante, llamada “elasticidad crítica” o “critical loss analysis” (CLA), aunque no es una herramienta exenta de defectos ( O’Brien & Wickelgren, 2003).
El CLA calcula la pérdida crítica del monopolista hipotético, es decir, la magnitud de las ventas perdidas que harían que la imposición de un aumento pequeño pero significativo y permanente del precio no sea rentable para el monopolista hipotético, y la compara con la llamada “pérdida real de ventas” que resultaría de este aumento.
Si el aumento de precios es rentable -es decir, la pérdida real de ventas, dada por la elasticidad estimada, es menor que la pérdida crítica de ventas- el mercado candidato puede considerarse como el mercado relevante adecuado. De lo contrario, el mercado candidato debe ser descartado.
Para estimar la pérdida real se pueden buscar pruebas directas sobre la capacidad de respuesta de la demanda. Esto puede incluir estudios econométricos o estudios de marketing. En ocasiones, podría bastar una evaluación intuitiva de hechos cualitativos sobre lo que supondría que un cliente dejara de consumir un grupo de productos.
La prueba SSNIP no es un método infalible.
Uno de los mayores riesgos a la hora de implementar este test es caer en la llamada “Falacia del celofán”. Este argumento advierte que no es posible determinar con exactitud el mercado relevante de un producto en ciertos casos, por ejemplo, cuando ya existe un elevado poder de mercado o se está en presencia de una colusión, dado que el test se aplicaría partiendo de precios distorsionados.
En estos casos, la elasticidad de la demanda del producto podría ser un mal indicador. Ante el alza de un precio que ya es demasiado alto, los consumidores considerarían que otros productos son suficientemente buenos sustitutos, algo que no ocurriría si el precio fuera más bajo (más cercano al nivel competitivo). Esto provoca que la prueba SSNIP pueda dar como resultado definiciones de mercado demasiado amplias, las concentraciones serían artificialmente bajas y, por lo mismo, daría lugar a falsas predicciones sobre la magnitud del poder de mercado ( Schaerr, 1985).
El nombre de esta limitación proviene del antiguo Caso Du Pont (1956). La empresa Du Pont argumentó que el papel celofán no era un mercado relevante independiente, puesto que se podía demostrar que el celofán tenía una elevada elasticidad cruzada de la demanda con otros materiales de envasado flexibles a los precios vigentes, como el papel de aluminio, el papel encerado y el polietileno. Sin embargo, el tribunal consideró que el precio vigente del papel celofán se encontraba por sobre el precio competitivo, por lo que no se podía considerar este hecho como evidencia de presión competitiva efectiva y determinó que el mercado relevante contenía únicamente al papel celofán.
Hay muchas situaciones en las que la prueba SSNIP no es viable, ya sea por las limitaciones de los datos o porque el mercado es altamente diferenciado y no es claro el orden en que deben añadirse los productos, si el mercado candidato inicial no es el adecuado.
Además, para analizar mercados de dos lados -cada vez más recurrentes en la práctica- los expertos argumentan que la prueba SSNIP tradicional no puede aplicarse como tal, sino que debe modificarse para tener en cuenta las externalidades indirectas de la red. (Hesse (2007), Filistrucchi (2008))
Como consecuencia de estas externalidades, en los mercados digitales a menudo se ofrecen servicios gratuitos a los consumidores, por lo que no se puede simular el aumento del precio tradicional de la prueba SSNIP al ser el precio igual a cero. Por este motivo, se emplean diferentes técnicas para definir el mercado relevante, algunas de ellas utilizando machine learning (Decarolis y Rovigatti (2019))
Si bien el test del monopolista hipotético no está libre de incertezas y dificultades y ha sido puesto en duda por diversos expertos, suele ser de gran utilidad para las agencias de competencia, dada la evidencia disponible, y también puede ser informativo como punto de partida de una investigación más detallada.
Muchas veces la información de las elasticidades propias y cruzadas de la demanda del producto es difícil de obtener o resulta compleja de determinar. A lo largo de los años, varios autores han propuesto enfoques alternativos para definir el mercado relevante.
Un enfoque alternativo sostiene que se puede considerar que los productos pertenecen al mismo mercado relevante si sus precios muestran cierta correlación. Este enfoque examina en qué medida cambian los precios relativos de los productos a lo largo del tiempo. Un alto grado de correlación de precios indica que los productos pertenecen al mismo mercado, ya que un aumento del precio de un producto provocaría la sustitución de la demanda, que a su vez aumentaría el precio del sustituto, dejando el precio relativo de los dos productos sin cambios. Katsoulacos et al., utilizan un conjunto completo de pruebas cuantitativas alternativas para delinear un mercado relevante.
A veces, los consumidores pueden ser incapaces de reaccionar a un aumento de precios, sin embargo, los productores pueden hacerlo, por ejemplo, aumentando su oferta para satisfacer la demanda de estos consumidores, reorganizando su producción para producir el producto que aumentó de precio. El mayor nivel de oferta puede hacer que el intento de alza de precios no sea rentable.
Las agencias de competencia y los tribunales también tienen en cuenta estas fuerzas de sustitución de la oferta para definir los mercados relevantes. Aun cuando un monopolista hipotético no encuentre rentable un SSNIP teniendo en cuenta la sustitución de la demanda, el mercado puede ampliarse en productos o en ubicación después de tener en cuenta los incentivos de los vendedores externos para empezar a producir y vender dentro del mercado candidato.
Sin embargo, no existe consenso acerca de en qué fase del proceso de análisis es mejor tener en cuenta la sustitución de la oferta y existen diferentes criterios en la Unión Europea y Estados Unidos.
Además, surgen dificultadas al determinar dónde está el límite en lo que se considera sustituto por el lado de la oferta. F.M. Scherer señala que “la línea debe ser tal que permita incluir como sustitutos sólo aquellas áreas potenciales de ofrecer con la capacidad instalada, es decir, sin requerir nueva inversión en plantas, equipos, etc.”. De lo contrario, las consideraciones de oferta tendrán que ser parte del análisis de condiciones o barreras a la entrada antes que de la definición de mercado relevante.
Al definir el mercado relevante también se debe tener en cuenta la dimensión geográfica, puesto que puede limitar la voluntad o la capacidad de los consumidores para sustituir productos, o bien, la voluntad o la capacidad de un proveedor para servir a los consumidores. Una misma empresa puede operar en varios mercados geográficos diferentes.
En pocas palabras, para determinar el mercado geográfico de un producto o servicio, el investigador se pregunta lo siguiente: si cambia el precio de un producto del área A, ¿se ve afectada la demanda en el área B? Si la demanda en el área B se ve afectada fuertemente, entonces ambos sectores deben ser considerados partes de un mismo mercado geográfico relevante.
El test del monopolista hipotético también se utiliza para definir el mercado geográfico. El mercado geográfico será aquel en que un monopolista hipotético de una zona geográfica es capaz de imponer de forma rentable un pequeño pero significativo aumento permanente del precio, manteniendo constantes las condiciones de venta de todos los productos producidos en otros lugares.
Este análisis asume que la discriminación geográfica de precios -esto es, cobrar diferentes precios netos de los costes de transporte por el mismo producto a los compradores de diferentes áreas- no sería rentable para un hipotético monopolista.
Sin embargo, si un monopolista hipotético puede identificar y fijar un precio diferente a los compradores de ciertas áreas, y estos no anularían el aumento del precio comprándole a vendedores más lejanos, y si otros compradores no comprarían el producto relevante y lo revenderían a los compradores que enfrentan un mayor precio, entonces un monopolista hipotético impondría un aumento de precios discriminatorio de forma rentable. Esto se cumple incluso cuando un aumento general de precios provocaría una sustitución tan importante que el aumento de precios no sería rentable (Horizontal Merger Guidelines, 2010).
Otra alternativa para definir el mercado geográfico relevante es el test Elzinga-Hogarty (1973). Sus autores propusieron que una zona determinada sería un mercado geográfico separado si recibe pocas importaciones y realiza pocas exportaciones. En palabras de los economistas, “poco entra de afuera” y “poco sale de adentro” (más detalles en la sección 4.3).
Típicamente, la aplicación del test de Elzinga y Hogarty se realiza a través de datos de comercio y patrones de viaje entre regiones, y fue ampliamente utilizado en Estados Unidos para casos de fusiones de hospitales. Un ejemplo es el caso Federal Trade Commission v Tenet Healthcare Corp (1999), en el cual se evaluó si los hospitales tenían el poder de atraer pacientes desde lugares lejanos, definiendo un amplio mercado geográfico.
Pese a lo anterior, la jurisprudencia norteamericana ha dejado en evidencia que se debe ser cauto con el uso del test Elzinga y Hogarty cuando se define el mercado geográfico (FTC, 2004). Si bien este test puede ser útil como punto de partida, o para verificar la robustez de la definición elegida, cuenta con deficiencias que lo sitúan más como un complemento que como el protagonista de la definición de mercado geográfico (Davis y Garcés, 2010).
El uso del test Elzinga y Hogarty fue perdiendo protagonismo debido a que, entre los años 1994 y 2000, de un total de 900 fusiones de hospitales, las autoridades solo objetaron 7 de ellas, perdiendo las 7 (todas se aprobaron). Esto ocurrió porque, la mayoría de las veces, las autoridades de competencia o Tribunales de justicia encargados de ver estos casos aceptaban la aplicación del test Elzinga-Hogarty propuesto por las partes fusionadas, el cual tendía a subestimar el impacto de la fusión sobre la competencia.
Así, como se ha visto previamente, la definición de los mercados geográficos puede ser complicada y requerir muchos datos, debido a factores como los costos de transporte, el idioma, la normativa, las barreras comerciales arancelarias y no arancelarias, la reputación y la disponibilidad de servicios.
Sin embargo, una vez que una autoridad de libre competencia cuenta con dichos insumos, puede optar por distintos métodos para determinar el mercado relevante geográfico. A grandes rasgos, un regulador podría definir el mercado de manera global, internacional, nacional, regional o local. Típicamente, todas esas especificaciones se definen empleando dimensiones geográficas preexistentes. Sin embargo, en algunos casos, sobre todo aquellos que se analizan con un enfoque local, la autoridad antimonopolio puede optar por crear una dimensión geográfica particular. Esta dimensión responde al concepto de isócronas.
En el pasado, los mercados geográficos solían ser delineados dibujando círculos de distintos tamaños alrededor de los sectores donde se distribuían insumos claves, o bien, en torno a asentamientos urbanos relevantes. Trazar círculos de manera arbitraria puede parecer poco sofisticado, no obstante, aquello sentó la intuición para lo que se conocería por isócronas en el futuro.
Una isócrona es una línea que agrupa en su interior todos los lugares que pueden ser alcanzados a través de un viaje de una duración constante de tiempo y desde un punto de partida determinado. En la actualidad, debido a los avances tecnológicos de softwares, se pueden delinear mercados geográficos más coherentes que los de antaño, que consideran características de las rutas y velocidades de viaje en las distintas zonas que se evalúan. En consecuencia, el trazado del mercado no resulta en un circulo perfecto, sino que cuenta con muchas irregularidades que surgen de las particularidades recién mencionadas (Niels, Jenkins y Kavangh, 2016).
La tecnología ha permitido que la “forma” del mercado geográfico —delimitado por la isócrona— deje de ser arbitraria. Sin embargo, el uso de las isócronas sigue estando sujeto a una cuota de arbitrariedad, proveniente del tiempo de traslado que utiliza para delimitar el mercado. ¿Es una isócrona de 5 minutos más apropiada que una de 10 o 20 minutos?
La respuesta a lo anterior no es obvia y, ciertamente, dependerá de las especificidades de cada caso. A pesar de esto, para determinar el tiempo de viaje relevante, las autoridades antimonopolio emplean datos de diversas fuentes para reducir la arbitrariedad de su elección. En esta línea, realizan encuestas, obtienen información sobre los costos de transporte o cualquier otra evidencia que sea indicativa respecto de los patrones de viaje de los consumidores. Con todo, en vista de que las autoridades siguen teniendo el deber de emitir un juicio en torno al tiempo relevante, siempre es posible —y útil— verificar la sensibilidad de los resultados, aumentando o disminuyendo sutilmente el tiempo utilizado.
¿Cómo se define el punto de partida de la isócrona? En la lógica del test del monopolista hipotético, el “centro” de la isócrona debería reflejar el “producto focal” de la manera más precisa posible. Un ejemplo de esto se puede observar en el caso ficticio analizado por Niels, Jenkins y Kavanagh (2016), donde el producto focal se definió conforme a uno de los cines de la cadena “A”.
Figura 1: Isócrona de 20 minutos para cadenas de cine en una ciudad ficticia
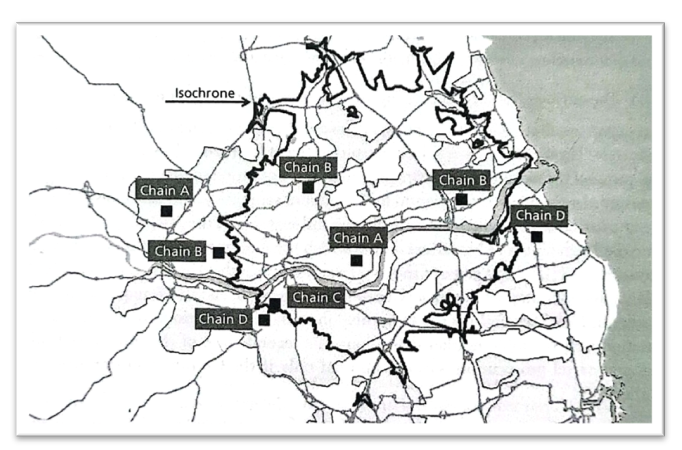
Fuente: Niels, Jenkins y Kavanagh (2016)
En la figura anterior, se observan 4 cadenas de cines que compiten en la ciudad: La cadena “A”, que cuenta con 2 locales; la cadena “B”, con 3; la cadena “C”, con 1 local; y, la cadena “D”, con 2 locales. El área demarcada corresponde a la isócrona de 20 minutos respecto del cine de la cadena “A” (ubicado en el centro). Su forma irregular responde —como se anticipaba previamente— a la velocidad, a la red de carreteras y a la posibilidad que tienen los potenciales clientes de acceder al determinado producto.
Si el regulador ficticio del caso anterior considerase la isócrona de 20 minutos como el mercado relevante geográfico, la competencia se daría entre el local de la cadena “A” ubicado en el centro, 2 locales de la cadena “B”, y un local de la cadena “C”. En cambio, si el mercado geográfico se definiera conforme al tamaño de la ciudad de la imagen, el operador “D” —con 2 locales— sería un competidor de la cadena “A”; además, el análisis debería considerar dos locales adicionales, uno para la cadena “A” y otro para la cadena “B”.
Si se asume que la decisión final del regulador considera a la isócrona de 20 minutos como mercado relevante geográfico, entonces es posible señalar que, como la cadena “D” no tiene presencia al interior de la isócrona, el operador “D” no ejerce presión competitiva a la cadena “A”.
La isócrona anterior está centrada en la oferta, pues se enfoca en la distribución del producto. Como se pudo observar, la isócrona se construyó con respecto al lugar en donde se ofrece el servicio, y no con respecto a la posición del cliente, que es quien lo demanda. La competencia entre cines no se da por el solo hecho de que estos se encuentran a 20 minutos de distancia (perspectiva de la oferta); sino que ocurre porque ambos se encuentran dentro del alcance de los mismos consumidores (perspectiva de la demanda). Por lo mismo, las isócronas basadas en la oferta pueden no representar con total precisión el mercado geográfico relevante.
Otro enfoque que se aplica es recentrar las isócronas a partir de los principales centros de población (en lugar de los locales de los vendedores), para evaluar qué puntos de venta son accesibles para los consumidores. Una arista puramente teórica sugeriría hacer esto para cada consumidor, sin embargo, dadas las restricciones de datos y la complejidad del proceso, es preferible considerar solo los principales centros poblacionales. Sin ir más lejos, en la práctica, es frecuente que los reguladores de libre competencia adopten incluso, por simplicidad, el enfoque basado en la oferta.
En Chile, por ejemplo, en la fusión SMU/Inmobiliaria Santander la Fiscalía Nacional Económica (FNE) utilizó isócronas de 5 a 15 minutos de desplazamiento para locales de supermercados (otorgando una mirada conservadora y otra menos restrictiva, respectivamente) en torno a una lista de locales de las partes fusionadas (enfoque desde la oferta). Los locales tenían la particularidad de encontrarse en zonas lo suficientemente remotas entre sí (comunas y regiones diferentes), de modo que cada isócrona era parte de un mercado relevante diferente (para profundizar en este caso, puedes revisar nuestra nota CeCo: Operación Unimarc/Montserrat: En paralelo FNE y TDLC dan luz verde).
De cualquier manera, el uso de las isócronas no se limita a casos relacionados con supermercados. En la práctica, esta forma de delimitar el mercado geográfico puede ser útil para, prácticamente, cualquier caso en que se busque analizar un mercado de manera local. Por ejemplo, la Office of Fair Trading (OFT) del Reino Unido ha empleado isócronas para fusiones relativas a casas de apuestas, cines, librerías y tiendas de bricolaje, por señalar algunas (Desai, 2008). Así, las isócronas constituyen una forma versátil de fijar el mercado geográfico relevante en contextos locales, y cuando se cuenta con datos sobre los desplazamientos o preferencias de los consumidores del sector.
En el análisis de competencia, una etapa inicial fundamental para medir el alcance del poder de mercado consiste en definir el mercado relevante. Esta etapa inicial tiene fuertes repercusiones en el análisis posterior de las conductas anticompetitivas, y es así como “El resultado de muchos casos (antimonopolio) ha girado más en torno a la definición del mercado que de cualquier otra cuestión de fondo» (Baker, 2007).
En 1997 la FTC de Estados Unidos decidió impugnar en tribunales la fusión de Staples y Office Depot, las dos principales tiendas de artículos de oficinas del país (para acceder a la demanda, ver aquí). La definición de mercado relevante fue un aspecto crucial en la resolución del tribunal de distrito (para acceder al fallo, ver aquí).
La agencia estadounidense afirmaba que el mercado relevante del producto se componía de la venta de suministros de oficina consumibles a través de supermercados especializados en artículos oficina. Bajo esta definición, la FTC no incluía productos tales como computadores, fax, otras máquinas de oficina y muebles, sino solamente productos como papel, lápices, carpetas de archivos, post-it y disquetes.
Por su parte, las empresas demandadas argumentaban que esta definición era muy “estrecha” y que la definición del mercado relevante debía incluir a todos los productos de oficina, de los cuales la fusión sólo tendría un 5,5% del total de venta en Estados Unidos. En cuanto al mercado geográfico existió consenso que abarcaba todas las áreas de los estados en que ambas empresas tenían tiendas.
Para acreditar su postura, la FTC presentó evidencia que comprobaba que los precios de Staples eran un 13% más altos en aquellos lugares donde no competía con Office Depot y OfficeMax, que en aquellos donde sí lo hacía. Además, los precios de Office Depot eran un 5% superiores en el mismo escenario.
Esta evidencia fue clave en la decisión de la Corte, ya que se podía concluir que las empresas demandadas no consideraban como competidores de sus productos a otras tiendas que podían vender artículos de oficina, como Wal-Mart, Kmart o Target. Éstas no ejercían suficiente presión competitiva sobre las demandadas como para evitar un alza de los precios.
En cambio, Staples, Office Depot y OfficeMax eran competidores suficientemente cercanos entre sí, como para que la «venta de suministros de oficina a través de supertiendas de oficina» pudiera definirse como un mercado separado de la venta de suministros de oficina en general.
El hecho de que un aumento pequeño pero significativo en los precios de Staples no tuviera como consecuencia una sustitución hacia los productos de otras tiendas de suministros de oficina consumibles fue considerado como evidencia suficiente, puesto que demostraba la baja elasticidad cruzada de la demanda entre los productos de las empresas demandadas y las otras tiendas. Finalmente, el tribunal de distrito concedió la orden para detener la fusión.
Este caso introdujo los estudios econométricos complejos sobre los cambios en los precios como parte de la evidencia para la definición del mercado relevante. Desde entonces, tanto las empresas como las agencias de competencia utilizan evidencia directa obtenida de los competidores más cercanos para definir el mercado y los efectos que una fusión puede llegar a tener en los precios y/o en el bienestar de los consumidores.
Además, los organismos antimonopolio se habían centrado tradicionalmente en el aumento de la probabilidad de colusión tras una fusión como principal fundamento teórico para impedir una fusión. Por el contrario, este caso se centró en la posibilidad de que una fusión tuviera «efectos unilaterales», como la subida de los precios.
Para un análisis detallado del caso, ver Dalkir y Warren-Boulton (2004).
El 20 de junio de 2008, la Fiscalía Nacional Económica (FNE) y la compañía Comercial Canadá Chemicals S.A. interpusieron una demanda ante el Tribunal de Defensa de la Libre Competencia (TDLC) contra Compañía Chilena de fósforos (CCF), por conductas de abuso de posición dominante de tipo exclusorio. En este caso hubo un intenso debate en torno a la definición del mercado relevante.
Por una parte, la FNE afirmaba que el mercado relevante correspondía al mercado de los fósforos (o cerillos) de seguridad comercializados en Chile. Esta definición excluía a los encendedores, pues la FNE afirmaba que estos se utilizan casi exclusivamente para cigarrillos, mientras que los fósforos se utilizan en artefactos de consumo doméstico, por lo que no serían sustitutos cercanos.
De acuerdo a la FNE, el hecho de que los fósforos se vendan principalmente en supermercados y los encendedores se vendan en negocios pequeños reforzaba la idea de dejar a los encendedores fuera del mercado relevante. Además, el “valor por luz” de los fósforos es alrededor de 1000% superior al de los encendedores.
CCF, en cambio, argumentaba que los fósforos sí se vendían a fumadores en pequeños negocios. Además, los fósforos grandes, ideales para uso hogareño y solo para ese uso, sólo representaban el 20% de las ventas de la empresa y argumentaba que si los fósforos solo se utilizaran con fines domésticos este número sería mayor. También la entrada de los encendedores ha coincidido con la caída de la industria del fósforo, lo que sería indiciario de sustitución. Para la demandada, se trataba de un único “mercado del encendido”, que incluía a fósforos y encendedores por igual.
La participación de CCF -y el consiguiente poder de mercado- cambiaban drásticamente en una y otra definición.
Finalmente, el TDLC le dio la razón a la FNE y definió el mercado como el mercado de fósforos en el territorio chileno, dado que no existiría una sustitución importante entre fósforos y encendedores que permitiese incluir a ambos.
El TDLC consideró que una prueba fundamental para determinar el grado de sustitución entre ambos productos era la estimación econométrica la demanda de fósforos en Chile, y la manera en que ésta era afectada exógenamente por el precio de los encendedores, la cual había sido presentada en un informe de CCF. La correlación entre la venta de fósforos y encendedores en Chile estimada era de -0,72, la cual no permitía asegurar que ambos productos fueran tan buenos sustitutos como para pertenecer al mismo mercado relevante según el tribunal.
También contribuyó a esta decisión el hecho que los productos se vendieran en distintos lugares -fósforos en supermercados y encendedores en negocios más pequeños- tal como se constataba en la información proporcionada por distintos actores del retail, entre otros informantes.
El TDLC concluyó que CCF sí tenía posición de dominio, entre otras razones, por tener alrededor del 80% del total de la participación del mercado relevante y ser el único productor de fósforos en Chile.
En 1994, Estados Unidos objetó la fusión de Mercy Health Services/ Finley Tri-States Health Group, quienes acordaron la asociación de sus hospitales en Dubuque, Iowa. Ambos establecimientos médicos eran los únicos que ofrecían cuidados intensivos a pacientes hospitalizados (mercado relevante del producto) en dicha localidad (pese a que existían otros recintos rurales en los alrededores). Si bien había una serie de hospitales regionales que proporcionaban los mismos servicios que brindaban Mercy y Finley, esto ocurría a 70-100 millas (entre 110 y 160 kilómetros) de Dubuque, de modo que la fusión constituía una operación compleja, especialmente por su definición de mercado geográfico.
El gobierno señalaba que el mercado geográfico incluía el condado de Dubuque y un semicírculo con un radio de 15 millas (un poco más de 24 kilómetros), cuya extensión abarcaba desde el extremo Este de Dubuque hasta Illinois y Wisconsin. Dicha definición posicionaba como competidores a Mercy, Finley y Galena-Stauss Hospital. El 88% de los pacientes cuyo origen estaba en la zona demarcada usaba uno de los 3 hospitales mencionados y solo el 2% de ellos se atendía en Galena-Stauss, el resto se atendía en Mercy o Finley.
En cambio, los demandados argumentaban que el mercado geográfico estaba constituido por Mercy, Finley, los siete hospitales rurales más cercanos y los hospitales regionales ubicados en Cedar Rapids, Waterloo, Iowa City, Davenport y Madison. En esta definición, los hospitales Mercy y Finley solo atendía al 10% de los pacientes presentes en dicha zona.
Estados Unidos defendió su definición en base a las opiniones de los principales consumidores de la atención médica en Dubuque, información sobre los lugares más privilegiados para desempeñarse como médico, las opiniones de los médicos y datos de flujo de pacientes. Con ello, el gobierno concluyó que los pacientes de Mercy y Finley no pueden cambiarse a un hospital rural debido a la lealtad con su médico. Además, se determinó que los médicos consideran a Mercy y Finley hospitales comparables, estando dispuestos a trabajar en ambos. Los hospitales rurales no ejercerían, bajo la defensa del gobierno de EE.UU., presión competitiva a Mercy y Finley.
Para verificar que el mercado geográfico era limitado, el gobierno empleo el test Elzinga-Hogarty. Esta prueba analiza los datos empíricos para determinar (1) el área de donde los hospitales extraen a sus pacientes y (2) a dónde van los residentes de esa área para recibir atención hospitalaria. Cuando ambos números están al 90%, se dice que la definición del mercado es «fuerte». En cambio, si los números están al 75%, se dice que la definición del mercado es «débil».
La definición de mercado geográfico sugerida por el gobierno cumplía con ser una definición “débil”, pues el 76% de los pacientes hospitalizados en Mercy o Finley provenían de esta zona geográfica, mientras que el 88% de quienes residían en la zona estipulada se atendía ahí. Aumentar el radio de 15 a 35 millas (de 24 a 56 kilómetros) respecto de Dubuque permitía lograr una definición “fuerte”. Según el gobierno, aún con ello, los hospitales regionales (que también proporcionaban cuidados intensivos) seguían permaneciendo fuera del mercado y solo podrían competir por los pacientes en los márgenes
Sin embargo, los demandados criticaron fuertemente la definición de mercado que propuso el gobierno, ya que dependía de supuestos incorrectos, a saber: i) que los pacientes eran lo suficientemente leales a los médicos como para no cambiarse a otro hospital; ii) que no estarían dispuestos a viajar grandes distancias para acudir a otro recinto médico y; iii) que las “exportaciones” e “importaciones” actuales de pacientes eran una buena aproximación de la sustituibilidad del producto desde la perspectiva de la demanda.
Adicionalmente, los hospitales Mercy y Finley sostuvieron que la argumentación del gobierno dependía demasiado de las características pasadas del mercado, sin tener en cuenta las tendencias actuales de este. Asimismo, sugerían que un aumento del precio de 5% de los fusionados sería suficiente para que los pacientes decidieran trasladarse a hospitales más lejanos para atenderse.
Finalmente, la confianza excesiva del gobierno en el test Elzinga-Hogarty fue contraproducente, pues el tribunal advirtió que el gobierno no logró establecer un mercado geográfico relevante que fuera adecuado. En su sentencia, el tribunal estuvo de acuerdo con la defensa de Mercy y Finley, en el sentido de que el gobierno hizo suposiciones inválidas y no analizó el caso con un enfoque dinámico, sino que optó por adoptar un enfoque estático, basado en eventos pasados. En consecuencia, el tribunal señaló que no se logró sostener que la fusión Mercy/Finley tendría efectos anticompetitivos y, por lo tanto, falló en favor de los demandados.
La definición del mercado relevante no es imprescindible para todos los casos de libre competencia, debido en parte al surgimiento de nuevas metodologías. También hay quienes consideran que la definición del mercado relevante es imposible e intentar definirlo es contraproducente, por lo que se debería abandonar esta metodología.
Farrell y Shapiro (2010) desarrollaron un indicador inicial para determinar si una propuesta de fusión entre competidores en una industria de productos diferenciados puede elevar los precios a través de efectos unilaterales.
Este indicador mide la presión al alza sobre los precios (upward pricing pressure) resultante de la fusión, lo cual requiere la comparación de dos fuerzas opuestas: la pérdida de competencia directa entre las partes que se fusionan, que crea una presión al alza de los precios, y el ahorro de costos marginales de la fusión, que crea una presión (compensatoria) a la baja de los precios. Si el efecto neto de estas dos fuerzas crea una presión al alza de los precios, la fusión debe ser sometida a un mayor escrutinio.
Esta medición, asentada en la práctica de agencias de competencia, se basa en los márgenes precio/costo de los productos de las empresas que se fusionan y en el grado de sustitución directa entre ellos. De acuerdo con los autores, este enfoque es práctico, más transparente y está mejor fundamentado en la economía que los métodos basados en la concentración.
En el derecho de la competencia, el paradigma de la definición de mercado/participación de mercado, según el cual se define un mercado relevante y se examinan las cuotas de mercado pertinentes en el mismo para luego hacer inferencias sobre el poder de mercado, ha generado una profunda discusión entre expertos. En esta discusión contrastan las opiniones del profesor de Harvard, Louis Kaplow, y el ex DoJ, Gregory J. Werden.
En su provocador ensayo “Why (ever) define markets?” (2010), Kaplow sostuvo que el proceso de definición de mercado es incoherente desde el punto de vista de los principios económicos básicos y, por tanto, debería abandonarse por completo.
Su principal argumento es la imposibilidad de determinar la mejor definición de mercado sin tener ya un prejuicio de una estimación óptima del poder de mercado. Se trataría de un ejercicio circular y tautológico, que vuelve inútil al análisis posterior y posiblemente conduzca a resultados erróneos.
Según Kaplow, en la práctica, para determinar si la definición de mercado A implica menos errores que la definición de mercado B, es necesario tener una opinión sobre la magnitud de estos errores. Ahora bien, estos errores consisten en la desviación entre la inferencia del poder de mercado derivada bajo una u otra definición de mercado y la mejor estimación propia del poder de mercado real. “Por lo tanto, la evaluación de los errores, necesaria para elegir el mercado relevante, presupone que uno ya ha formulado su mejor estimación. Por lo tanto, definir los mercados es inútil”.
Como réplica, Gregory Werden publicó su “Why (ever) define market: An answer to Professor Kaplow” en defensa de la herramienta. En su artículo afirma tajante: “la delimitación del mercado sirve para fines que el profesor Kaplow pasa por alto, no requiere una evaluación previa del poder de mercado y no puede abandonarse”.
Según Werden, la delimitación del mercado es necesaria para examinar cuestiones como las barreras a la entrada y la durabilidad del poder de mercado, no solo las cuotas de mercado. Además, asegura que el método propuesto por Kaplow para evaluar el poder de mercado sin definir previamente el mercado relevante, no funciona cuando ese poder deriva de la venta de múltiples bienes sustitutos.
Werden considera que, si bien las herramientas de la economía moderna permiten a menudo un análisis cuantitativo fiable -como en la evaluación de efectos competitivos probables de las fusiones horizontales-, estas herramientas deben complementarse con la delimitación del mercado.
En la economía digital han surgido mercados donde los bienes o servicios se ofrecen gratuitamente (en términos monetarios), especialmente en plataformas multilaterales como motores de búsqueda y redes sociales que conectan grupos de usuarios interdependientes. En estos casos, la contraprestación del consumidor-usuario generalmente son sus datos personales (y no personales), o simplemente su atención.
Las herramientas tradicionales para definir el mercado relevante, como el SSNIP test, no son aplicables cuando el precio inicial es cero, ya que no se pueden realizar incrementos de precio ni observar cambios en el comportamiento del consumidor. Esto dificulta evaluar la sustitución de la demanda y delimitar con precisión el mercado utilizando métodos convencionales, lo que conlleva a la necesidad de emplear metodologías alternativas (O’Donoghue y Padilla, 2020).
Una de las principales propuestas es el SSNDQ test, el cual es una adaptación del enfoque del SSNIP test. En lugar de analizar incrementos de precio, esta prueba examina si una reducción significativa y no transitoria en la calidad de un servicio lleva a los usuarios a optar por alternativas sustitutas. Algunos aspectos clave de la calidad considerados incluyen la experiencia de uso, seguridad, privacidad, entre otros (Mandrescu, 2018).
Por ejemplo, se puede hipotetizar una disminución del 25% en la calidad de un motor de búsqueda. Si esta degradación motiva a los consumidores a cambiar de proveedor, se delimita el mercado relevante basándose en la sensibilidad de los usuarios a tales cambios en la calidad.
Sin embargo, los defensores del SSNDQ test reconocen que su aplicación práctica enfrenta desafíos significativos. Esto, en cuanto a las dificultades para definir y medir la calidad del bien o servicio con precisión, lo que limita el uso de esta herramienta. En efecto, la “gracia” del SSNIP test es, precisamente, su operatividad matemática posibilitada por la valoración en precios (OCDE, 2013).
Silva (2024) revisa otras herramientas para definir el mercado relevante en contextos de precio cero. Una de ellas es el SSNIC test. Esta prueba analiza cómo reaccionarían los consumidores ante un aumento del 5% al 10% en costos no monetarios. Si este cambio induce a los usuarios a migrar a otros productos, se puede delimitar el mercado relevante en función de su sensibilidad a estos costos (Newman, 2016).
Por otra parte, está la propuesta del A-SSNIP test, basado en la idea de que en mercados de precio cero, el «precio» real es la atención del usuario. Esta herramienta, aplicada a plataformas de redes sociales, evalúa cómo reaccionarían los consumidores ante un aumento pequeño pero significativo y no transitorio en mensajes no deseados o en la carga publicitaria (ver nota CeCo sobre el “mercado de la atención”). Al enfocarse en la atención como recurso valioso, este método permite analizar la sustitución de la demanda y definir el mercado relevante considerando la sensibilidad de los usuarios a cambios en este «precio atencional» (Wu, 2019).
Desai, K. (2008). Isochrones: Analysis of Local Geographic Markets. Mayer Brown.
Kaplow, L. (2010). Why (ever) Define Markets?. Harvard Law Review, 437-517.
Niels, G., Jenkins, H., & Kavanagh, J. (2016). Economics for Competition Lawyers.
Simon, B., & Darcey, M. (1995). A Relevant Market Is Something Worth Monopolising. Unpublished Mimeo.
United States v. E. I. du Pont de Nemours & Co., 351 U.S. 377 (1956).
Wu, T. (2019). Blind Spot: The Attention Economy and the Law. Antitrust Law Journal, 82(3), 797.
** El glosario original fue modificado originalmente con fecha 23 de noviembre de 2022, agregando la sección 3.1 “Isócronas” y la sección 4.3 “EE. UU: Caso Mercy Health Services/ Finley Tri-States Health Group”. Luego, fue modificado el 10 de febrero agregando la sección 6 “Desafíos en la definición del mercado relevante con bienes de precio cero”, incluyendo las subsecciones 6.1 “Small but Significant Non-Transitory Decrease in Quality (SSNDQ)” y 6.2 “Otras herramientas propuestas”.